

QQQ has experienced a significant pullback, dropping 8.8% from its high of $540.81 reached on February 19, 2025. As of March 21, 2025, QQQ closed at $481.25, showing some recovery from recent lows
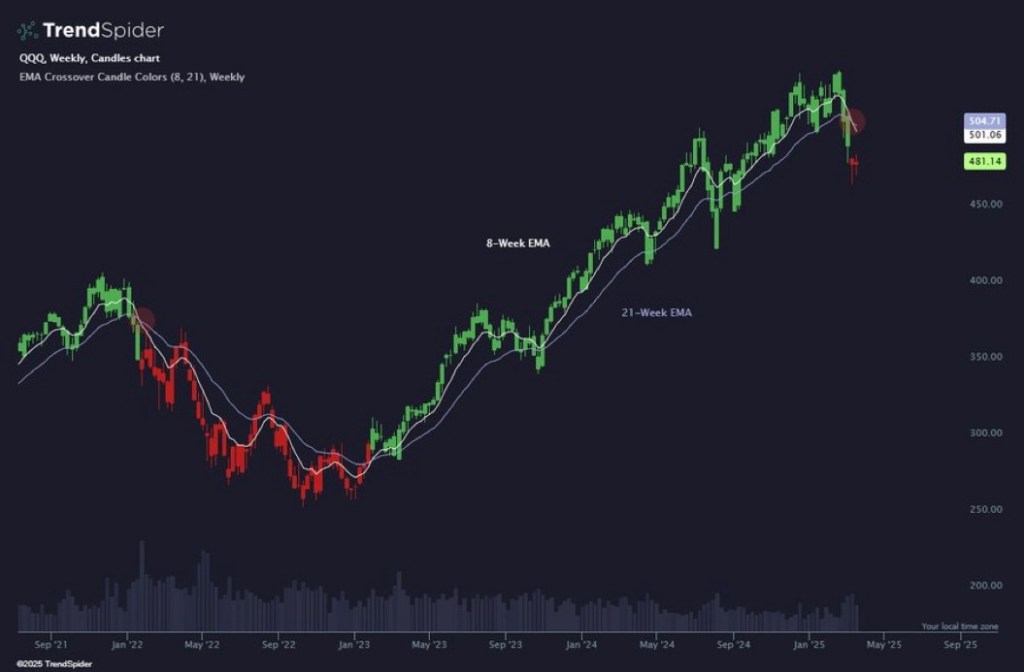
EMA Crossover: The 8 EMA crossing below the 21 EMA on the weekly chart is indeed a bearish signal, similar to the 2022 event.
Support Levels: QQQ recently tested its 200-day moving average at $491.79 and bounced back. This level could act as crucial support.
Trend Analysis: The ETF is currently showing sell signals from both short-term and long-term moving averages, indicating a negative forecast.
Broader Market: The S&P 500 is also testing critical support levels, suggesting this isn’t isolated to tech stocks.
Economic Factors: Unlike 2022, current economic conditions and the reasons for the pullback may differ, potentially affecting the duration and severity of any downturn.
Fakeout: This could be a temporary pullback within a larger bullish trend, especially if QQQ holds above key support levels.
Correction: A 10% correction to around $486.73 is possible without entering bear market territory.
Bear Market: A more severe decline below $432.65 (20% from the peak) would confirm a new bear market.
Discover how we can elevate your portfolio and deliver exceptional growth. NEW Monthly Payout Of At Least 0.5% In US Dollars
Contact Us: bit.ly/Alpha-Binwani-Capital
Website: alphabinwanicapital.com
Facebook Group: bit.ly/AlgoFBGroup
#MarketAnalysis #QQQ #BearMarketConcerns #EMACrossover #InvestmentStrategy
